Osaka Kokusai

日本、〒541-0052大阪府大阪市中央区安土町2丁目3−13大阪国際ビルディング 31階, 大阪, 日本, 541-0052

大阪国際ビジネスセンターは大阪国際ビルディングの最上階31階にございます。 
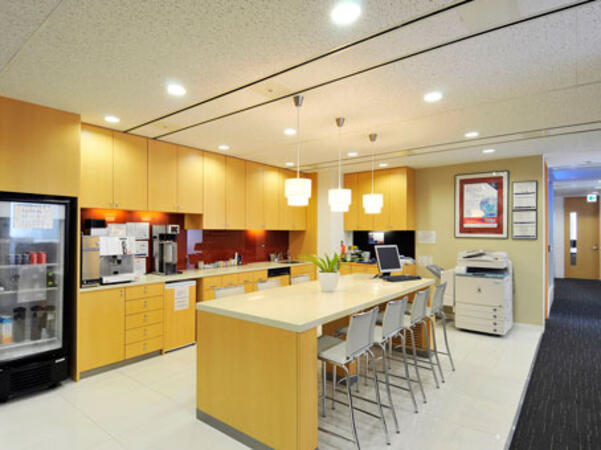
大阪国際ビルディングは、大阪を代表するビジネス街である本町のランドマークビルです。窓が大きく取られ、自然光をふんだんに取り込めるのが特徴です。 大阪は、日本市場への参入、特にサービス分野およびIT分野において参入を図る海外企業にとって魅力的な選択肢です。関西地方には電気機器、化学、食品、製薬、金融の分野における一流の国際企業が本社を構えています。近年は環境・エネルギー関連産業の有力企業が多数ビジネス拠点を構え、バッテリー製造の中心地となっています。 オフィスは交通の便が非常に良く、地下鉄「堺筋本町駅」まで徒歩2分、「本町駅」までは徒歩5分、梅田・大阪エリア、心斎橋・難波エリアへも地下鉄で5分以内です。また、大阪国際空港、関西国際空港へも40分弱です。周辺にはレストランやホテルなどの施設が充実しています。

Subcategories (3)

Explore Our Courses

Grafana: Interactive Dashboards and Dynamic Thresholds

14 時間

Grafana Comprehensive

21 時間

Scaling and Optimizing Prometheus and Grafana for Large Environments

14 時間

Custom Metrics and Instrumentation with Prometheus and Grafana

14 時間

Data Visualization with Google Colab

14 時間

Monitoring Kubernetes with Prometheus and Grafana

14 時間

Advanced Alerting and Automation with Grafana and Prometheus

14 時間

Integrating Grafana and Prometheus with Cloud Services

14 時間

Building Effective Dashboards with Grafana and Prometheus

14 時間

Monitoring with Grafana and Prometheus

14 時間

Introduction to Grafana and Prometheus

14 時間

Grafana and GLPI Administration

21 時間

Advanced Elasticsearch and Kibana Administration

35 時間

Advanced Grafana

14 時間

A Practical Introduction to Data Science

35 時間

Python with Plotly and Dash

14 時間

Data Analysis with SQL, Python and Spotfire

14 時間

Advanced Data Analysis with TIBCO Spotfire

14 時間

D3.js for Data Visualization

7 時間

Data Visualization

28 時間

Data Visualization: Creating Captivating Reports

21 時間

Data Visualization Principles for Tableau

14 時間

Apache Druid for Real-Time Data Analysis

21 時間

ELK: Elasticsearch, Logstash and Kibana for Administrators

14 時間

Foundation R

7 時間

Monitoring with Grafana

14 時間

Grafana and Graphite

14 時間

Kibana: Essentials

14 時間

Octave not only for programmers

21 時間

Power BI Dashboards

14 時間

Creating Dashboards Using Microsoft Power BI

14 時間

Power BI Dashboard Design

7 時間

Power BI for Business Analysts

21 時間

Data Visualization with Python

14 時間

Qlik Sense for Data Science

14 時間

QlikView for Business Users

7 時間

QlikView for Developers

14 時間

Introduction to Spotfire

14 時間

AI-Driven Data Analysis with TIBCO Spotfire X

14 時間

Data Analysis with Tableau and Python

14 時間

Data Visualization for Nonprofit using Tableau Public

21 時間

Tableau Intermediate Training Course

14 時間

TIBCO for Developers

21 時間

TIBCO Statistica

14 時間

Introduction to Data Visualization with Tidyverse and R

7 時間

From Tableau Beginners to Advanced User

28 時間

Zeppelin for Interactive Data Analytics

14 時間

Last Updated:

お客様の声 (16)

Upcoming Courses

大阪のデータの視覚化トレーニングコース, 大阪の週末データの視覚化コース, 大阪の夜のデータの視覚化トレーニング, 大阪のインストラクターによるデータの視覚化s, 大阪の夜のデータの視覚化コース, 大阪のデータの視覚化トレーナー, 大阪のインストラクターによるデータの視覚化s, 大阪のデータの視覚化クラス, 大阪のデータの視覚化1対1のトレーニング, 大阪のデータの視覚化指導, 大阪のオンサイトのデータの視覚化sトレーニング, 大阪のデータの視覚化プライベートコース, 大阪の週末データの視覚化トレーニング, 大阪のデータの視覚化ブートキャンプ, 大阪のデータの視覚化インストラクター