Nagoya - Meieki Minami

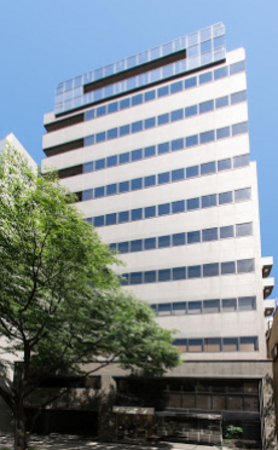
〒450-0002愛知県名古屋市中村区名駅5-31-10リンクス名駅ビル 5階・6階, 名古屋, 日本, 450-0002

日本第三の都市、愛知県名古屋市。そのターミナル駅である名古屋駅の中心地、名駅エリアに「オープンオフィス名駅東」は位置します。名駅エリアは2015年から2017年にかけて、大型オフィスが続けて竣工し、多くの企業が、この名駅エリアに集まることが予想されています。さらには、2027年のリニア新幹線開通を控え、いま、最も注目を浴びている街の一つです。 名古屋といえば、トヨタ自動車をはじめとした自動車製造業の本拠地として、世界的にも有名です。自動車だけでなく、名古屋には日本を代表する多くの製造業の本社があり、関連企業やパートナー企業も含め、製造業を中心としたビジネスタウンが形成されています。また近年では、IT関連業の名古屋進出も多くなっております。 再開発の注目度だけでなく、東京・大阪・各都市へのアクセス、通勤・営業活動にも便利な名駅エリアは、人気の高いビジネスエリアになっています。 利用可能なサービス

Subcategories (3)

Explore Our Courses

Grafana: Interactive Dashboards and Dynamic Thresholds

14 時間

Grafana Comprehensive

21 時間

Scaling and Optimizing Prometheus and Grafana for Large Environments

14 時間

Custom Metrics and Instrumentation with Prometheus and Grafana

14 時間

Data Visualization with Google Colab

14 時間

Monitoring Kubernetes with Prometheus and Grafana

14 時間

Advanced Alerting and Automation with Grafana and Prometheus

14 時間

Integrating Grafana and Prometheus with Cloud Services

14 時間

Building Effective Dashboards with Grafana and Prometheus

14 時間

Monitoring with Grafana and Prometheus

14 時間

Introduction to Grafana and Prometheus

14 時間

Grafana and GLPI Administration

21 時間

Advanced Elasticsearch and Kibana Administration

35 時間

Advanced Grafana

14 時間

A Practical Introduction to Data Science

35 時間

Python with Plotly and Dash

14 時間

Data Analysis with SQL, Python and Spotfire

14 時間

Advanced Data Analysis with TIBCO Spotfire

14 時間

D3.js for Data Visualization

7 時間

Data Visualization

28 時間

Data Visualization: Creating Captivating Reports

21 時間

Data Visualization Principles for Tableau

14 時間

Apache Druid for Real-Time Data Analysis

21 時間

ELK: Elasticsearch, Logstash and Kibana for Administrators

14 時間

Foundation R

7 時間

Monitoring with Grafana

14 時間

Grafana and Graphite

14 時間

Kibana: Essentials

14 時間

Octave not only for programmers

21 時間

Power BI Dashboards

14 時間

Creating Dashboards Using Microsoft Power BI

14 時間

Power BI Dashboard Design

7 時間

Power BI for Business Analysts

21 時間

Data Visualization with Python

14 時間

Qlik Sense for Data Science

14 時間

QlikView for Business Users

7 時間

QlikView for Developers

14 時間

Introduction to Spotfire

14 時間

AI-Driven Data Analysis with TIBCO Spotfire X

14 時間

Data Analysis with Tableau and Python

14 時間

Data Visualization for Nonprofit using Tableau Public

21 時間

Tableau Intermediate Training Course

14 時間

TIBCO for Developers

21 時間

TIBCO Statistica

14 時間

Introduction to Data Visualization with Tidyverse and R

7 時間

From Tableau Beginners to Advanced User

28 時間

Zeppelin for Interactive Data Analytics

14 時間

Last Updated:

お客様の声 (16)

Upcoming Courses

Other regions in 日本

名古屋のデータの視覚化トレーニングコース, 名古屋の週末データの視覚化コース, 名古屋の夜のデータの視覚化トレーニング, 名古屋のインストラクターによるデータの視覚化s, 名古屋のオンサイトのデータの視覚化sトレーニング, 名古屋のデータの視覚化ブートキャンプ, 名古屋の夜のデータの視覚化コース, 名古屋の週末データの視覚化トレーニング, 名古屋のインストラクターによるデータの視覚化s, 名古屋のデータの視覚化1対1のトレーニング, 名古屋のデータの視覚化クラス, 名古屋のデータの視覚化プライベートコース, 名古屋のデータの視覚化トレーナー, 名古屋のデータの視覚化インストラクター, 名古屋のデータの視覚化指導