Yokohama - Kannai Business Center

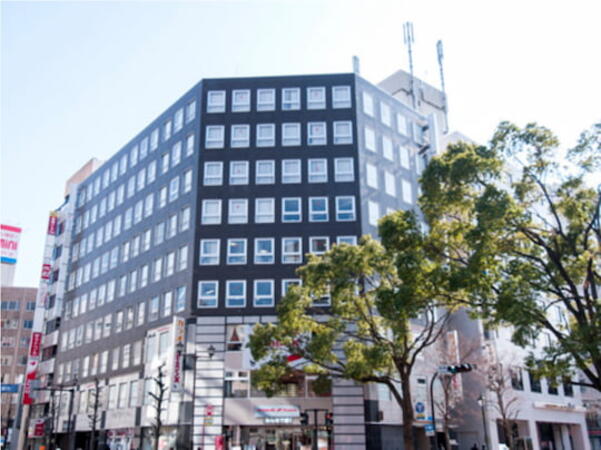
日本、〒231-0015 神奈川県横浜市中区尾上町4-57横浜尾上町ビルデイング 8階, 横浜, 日本, 231-0015

関内ビジネスセンターはJR関内駅北口から徒歩3分、市営地下鉄ブルーライン関内駅直結の横浜尾上町ビルディング内にあります。首都高横羽線から海岸沿いまでは、県庁、市役所、税関、その他港湾関連施設が多いため、さまざまな規模の商社、輸出入関連会社が集中し昔から外国人定住者が多いエリアです。 ビジネスタウンとしてだけでなく、海岸線周辺に観光スポットが点在しているので週末も散策の人が絶えません。首都圏のハブである横浜駅へのアクセスも良く、東急東横線の急行に乗れば渋谷までわずか30分です。横浜のみのビジネスだけではなく、東京周辺との行き来が多い場合にもおすすめです。

Subcategories (3)

Explore Our Courses

Grafana: Interactive Dashboards and Dynamic Thresholds

14 時間

Grafana Comprehensive

21 時間

Scaling and Optimizing Prometheus and Grafana for Large Environments

14 時間

Custom Metrics and Instrumentation with Prometheus and Grafana

14 時間

Data Visualization with Google Colab

14 時間

Monitoring Kubernetes with Prometheus and Grafana

14 時間

Advanced Alerting and Automation with Grafana and Prometheus

14 時間

Integrating Grafana and Prometheus with Cloud Services

14 時間

Building Effective Dashboards with Grafana and Prometheus

14 時間

Monitoring with Grafana and Prometheus

14 時間

Introduction to Grafana and Prometheus

14 時間

Grafana and GLPI Administration

21 時間

Advanced Elasticsearch and Kibana Administration

35 時間

Advanced Grafana

14 時間

A Practical Introduction to Data Science

35 時間

Python with Plotly and Dash

14 時間

Data Analysis with SQL, Python and Spotfire

14 時間

Advanced Data Analysis with TIBCO Spotfire

14 時間

D3.js for Data Visualization

7 時間

Data Visualization

28 時間

Data Visualization: Creating Captivating Reports

21 時間

Data Visualization Principles for Tableau

14 時間

Apache Druid for Real-Time Data Analysis

21 時間

ELK: Elasticsearch, Logstash and Kibana for Administrators

14 時間

Foundation R

7 時間

Monitoring with Grafana

14 時間

Grafana and Graphite

14 時間

Kibana: Essentials

14 時間

Octave not only for programmers

21 時間

Power BI Dashboards

14 時間

Creating Dashboards Using Microsoft Power BI

14 時間

Power BI Dashboard Design

7 時間

Power BI for Business Analysts

21 時間

Data Visualization with Python

14 時間

Qlik Sense for Data Science

14 時間

QlikView for Business Users

7 時間

QlikView for Developers

14 時間

Introduction to Spotfire

14 時間

AI-Driven Data Analysis with TIBCO Spotfire X

14 時間

Data Analysis with Tableau and Python

14 時間

Data Visualization for Nonprofit using Tableau Public

21 時間

Tableau Intermediate Training Course

14 時間

TIBCO for Developers

21 時間

TIBCO Statistica

14 時間

Introduction to Data Visualization with Tidyverse and R

7 時間

From Tableau Beginners to Advanced User

28 時間

Zeppelin for Interactive Data Analytics

14 時間

Last Updated:

お客様の声 (16)

Upcoming Courses

横浜のデータの視覚化トレーニングコース, 横浜の週末データの視覚化コース, 横浜の夜のデータの視覚化トレーニング, 横浜のインストラクターによるデータの視覚化s, 横浜のデータの視覚化プライベートコース, 横浜のインストラクターによるデータの視覚化s, 横浜のデータの視覚化トレーナー, 横浜のオンサイトのデータの視覚化sトレーニング, 横浜のデータの視覚化ブートキャンプ, 横浜のデータの視覚化インストラクター, 横浜のデータの視覚化指導, 横浜のデータの視覚化クラス, 横浜のデータの視覚化1対1のトレーニング, 横浜の週末データの視覚化トレーニング, 横浜の夜のデータの視覚化コース